

physics-plot is essentially a zero dependency python package shipping a Matplotlib style sheet — pp_base.mplstyle to create publication-quality plots with minimal effort. In addition, a few optional helper classes are provided.
- Matplotlib style sheet —
physics_plot.pp_baseenforces serif fonts, LaTeX math, minimalist grids, and high-resolution exports out of the box. - Legend utilities —
physics_plot.Handlesmakes it easy to build custom legend entries for artists (e.g., violin plots) that don’t expose alabelargument.
pip install physics-plotphysics-plot can be installed via pip:
pip install physics-plotThere are basically two ways to use the physics-plot stylesheet. You can set it globally at the start of your script/notebook:
import matplotlib.pyplot as plt

plt.style.use("physics_plot.pp_base")

# ======================= #
# Your plotting code here #
# ======================= #
Or you can apply it to individual figures using a context manager:
import matplotlib.pyplot as plt

with plt.style.context("physics_plot.pp_base"):
    # ======================= #
    # Your plotting code here #
# ======================= #-
Bode plot (
examples/bode-plot.py) generates a two-panel magnitude/phase plot for a first-order low-pass filter.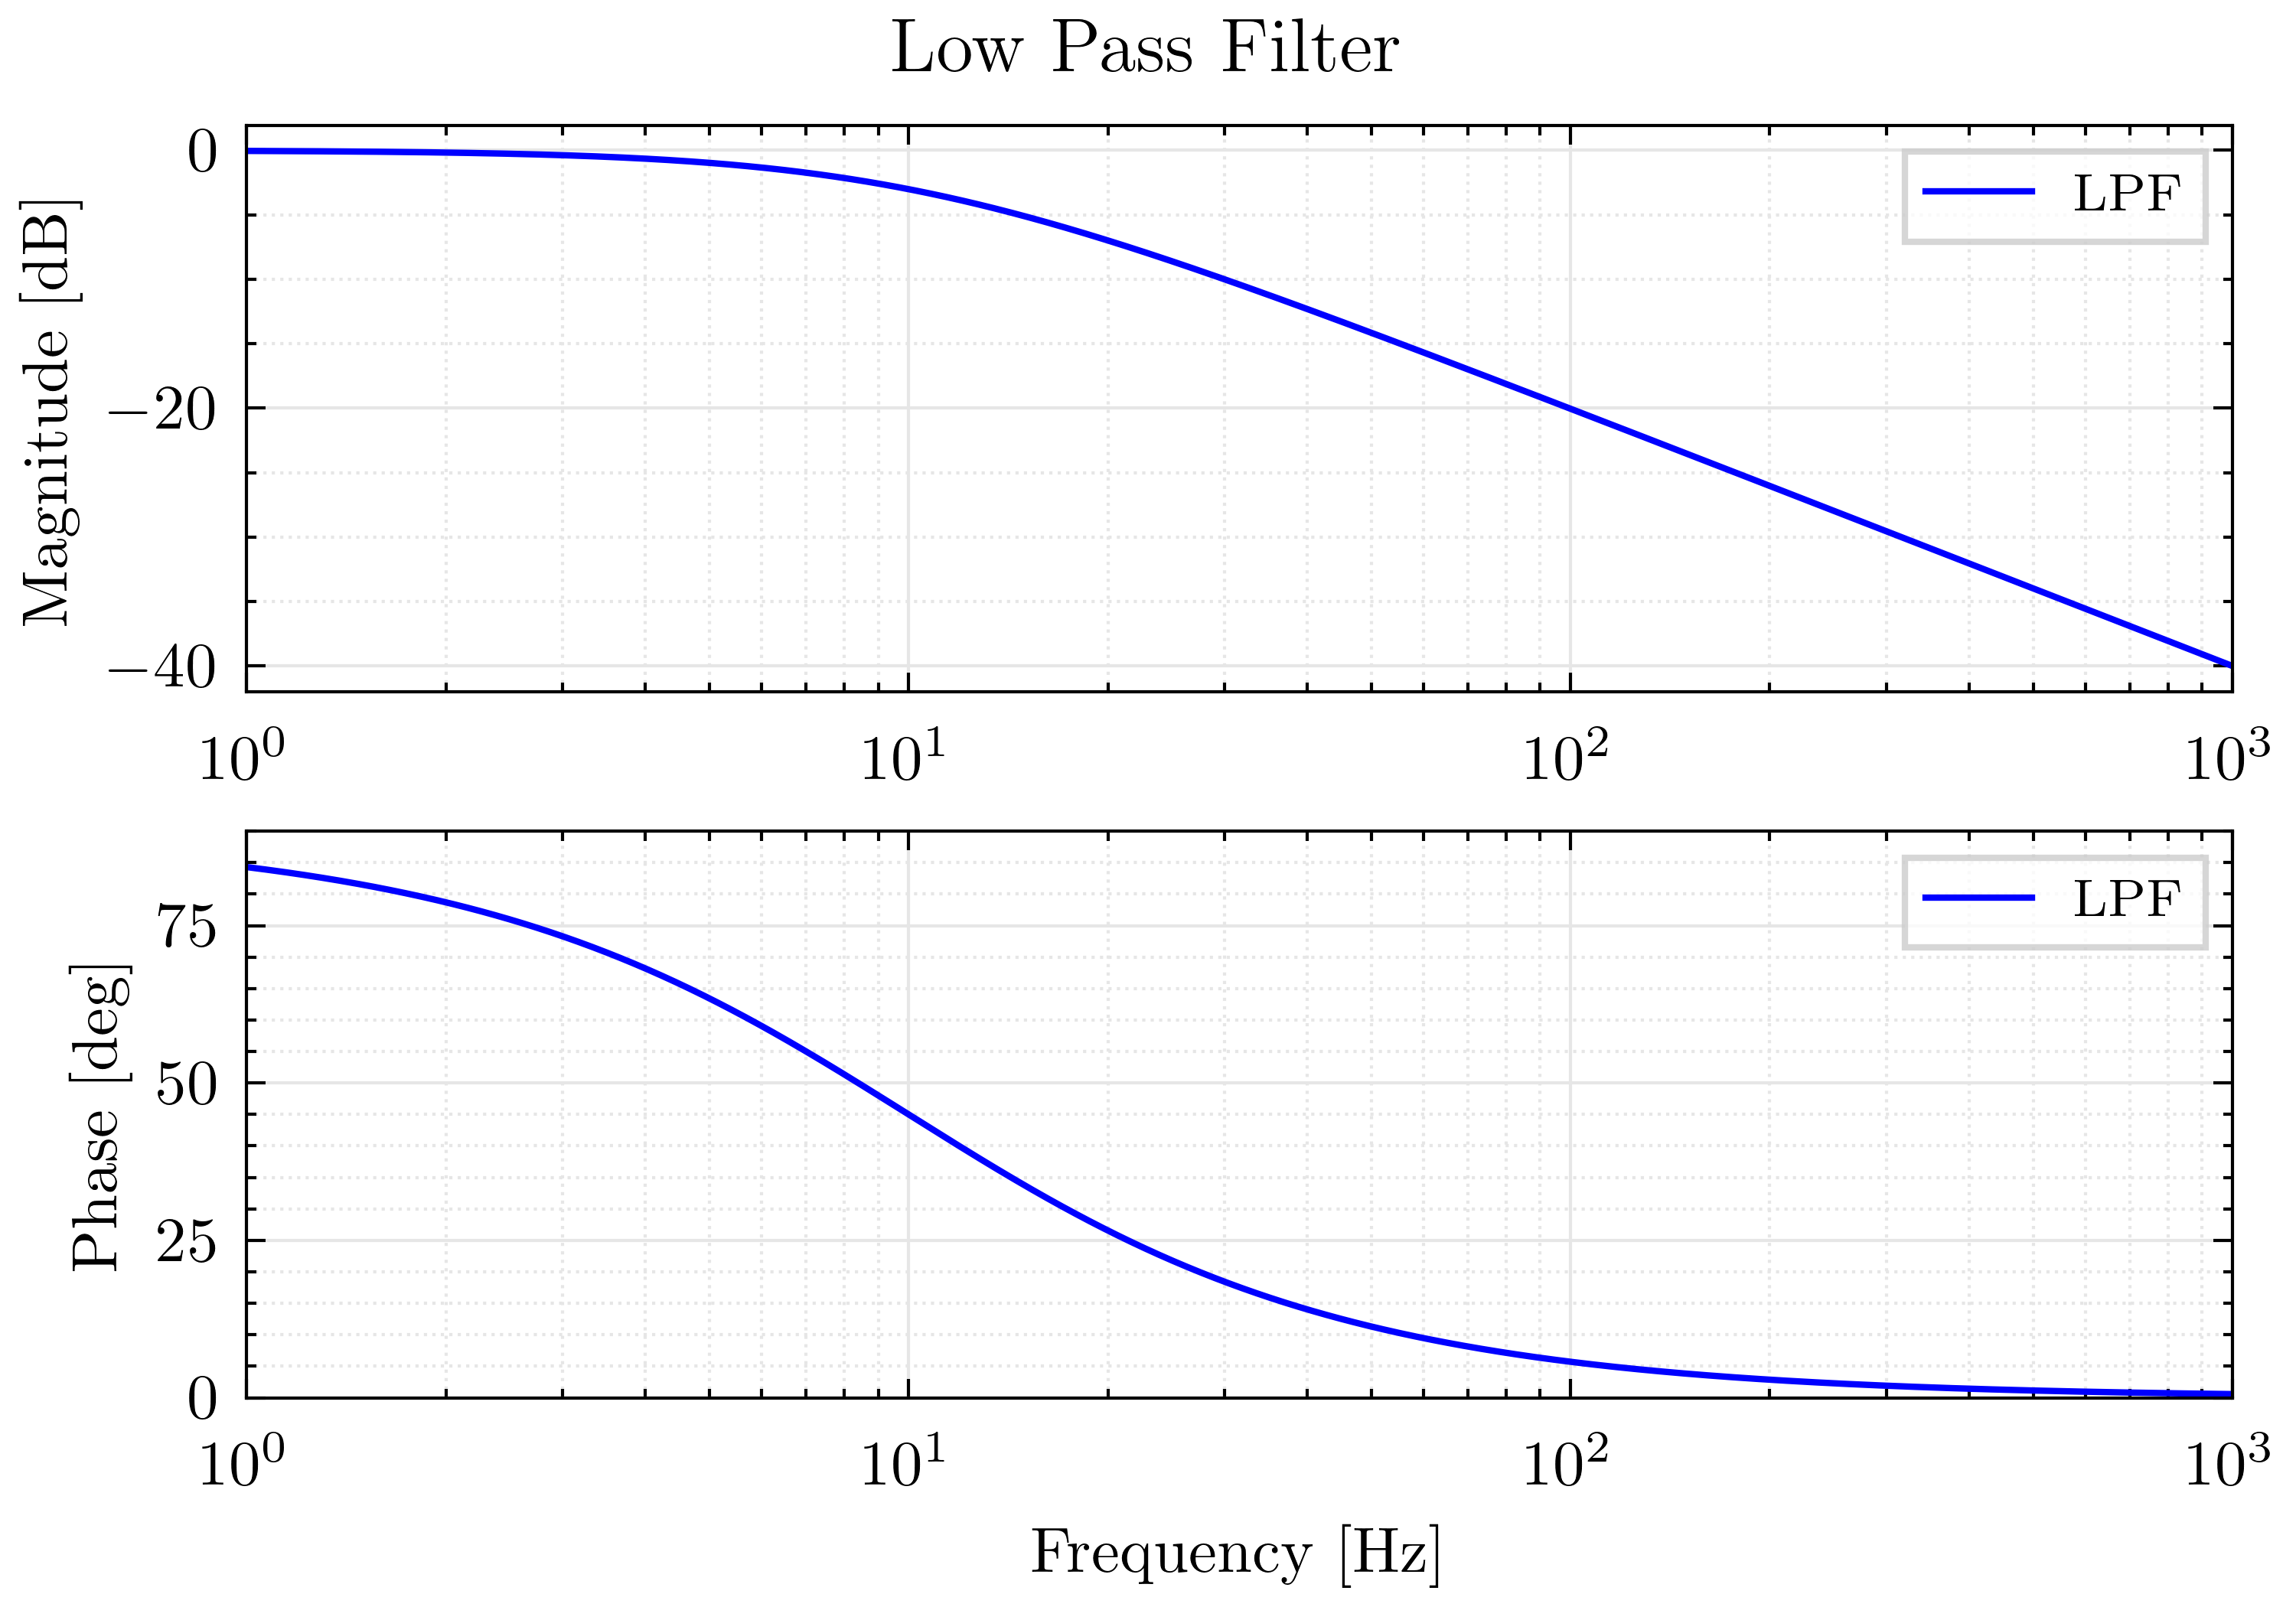
-
Violin plot (
examples/violin-plot.ipynb) demonstrates how to pairHandleswithAxes.violinplotso the legend of the violin plot can be created, which is absent in Matplotlib.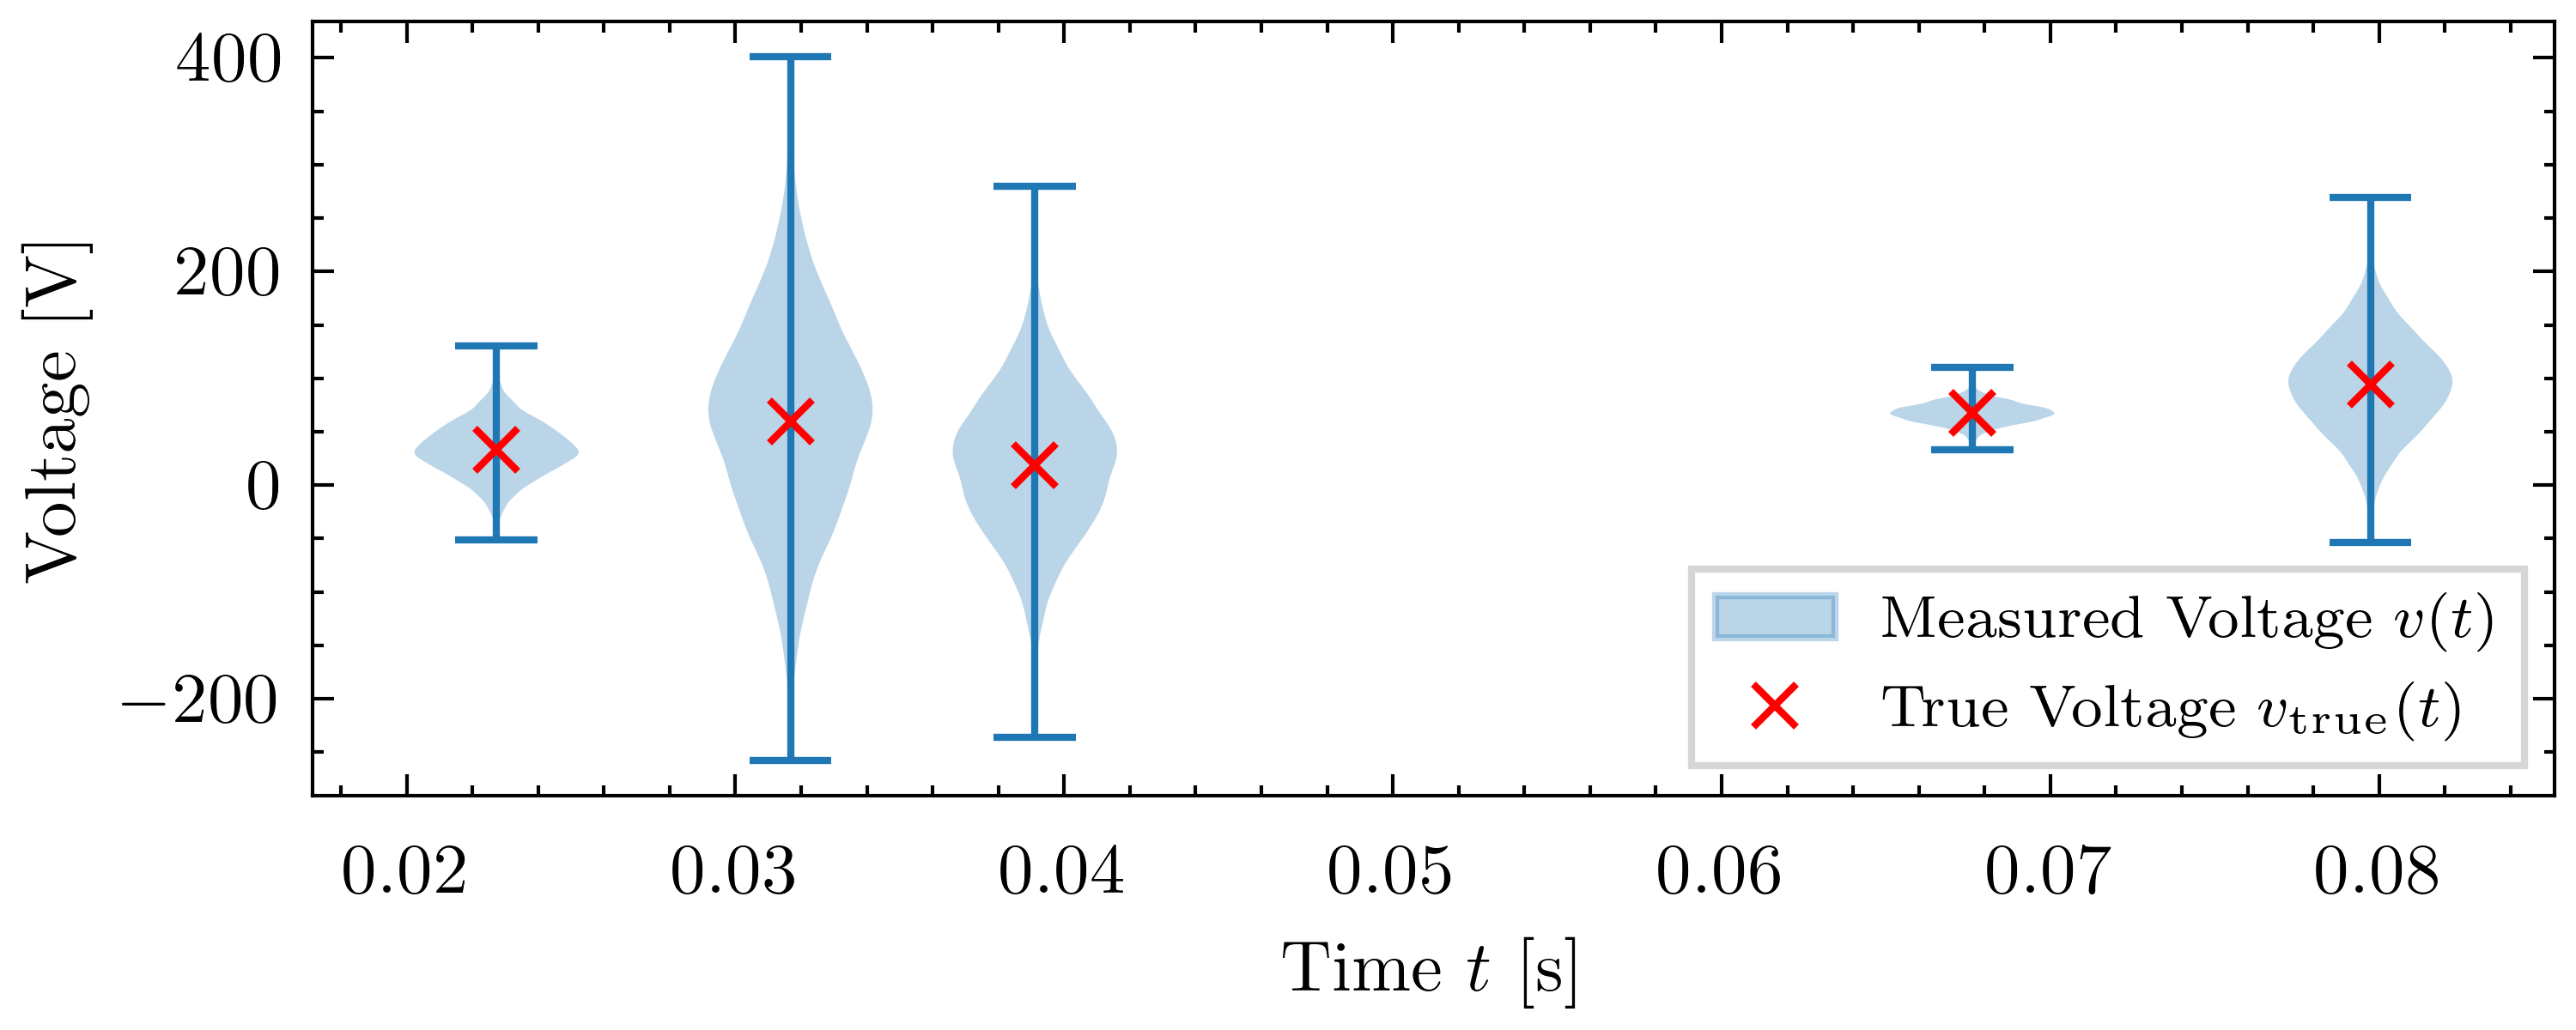
Feel free to start from either example when styling your own figures.
- Coming soon
This project is licensed under the MIT license.
This project includes or adapts files from:
- SciencePlots (MIT License) Copyright (c) 2018 John Garrett
- Matplotlib (BSD-compatible license) Copyright (c) 2012– Matplotlib Development Team
- Seaborn (BSD 3-Clause License) Copyright (c) 2012–2023, Michael L. Waskom