Tutorials Topic Modeling
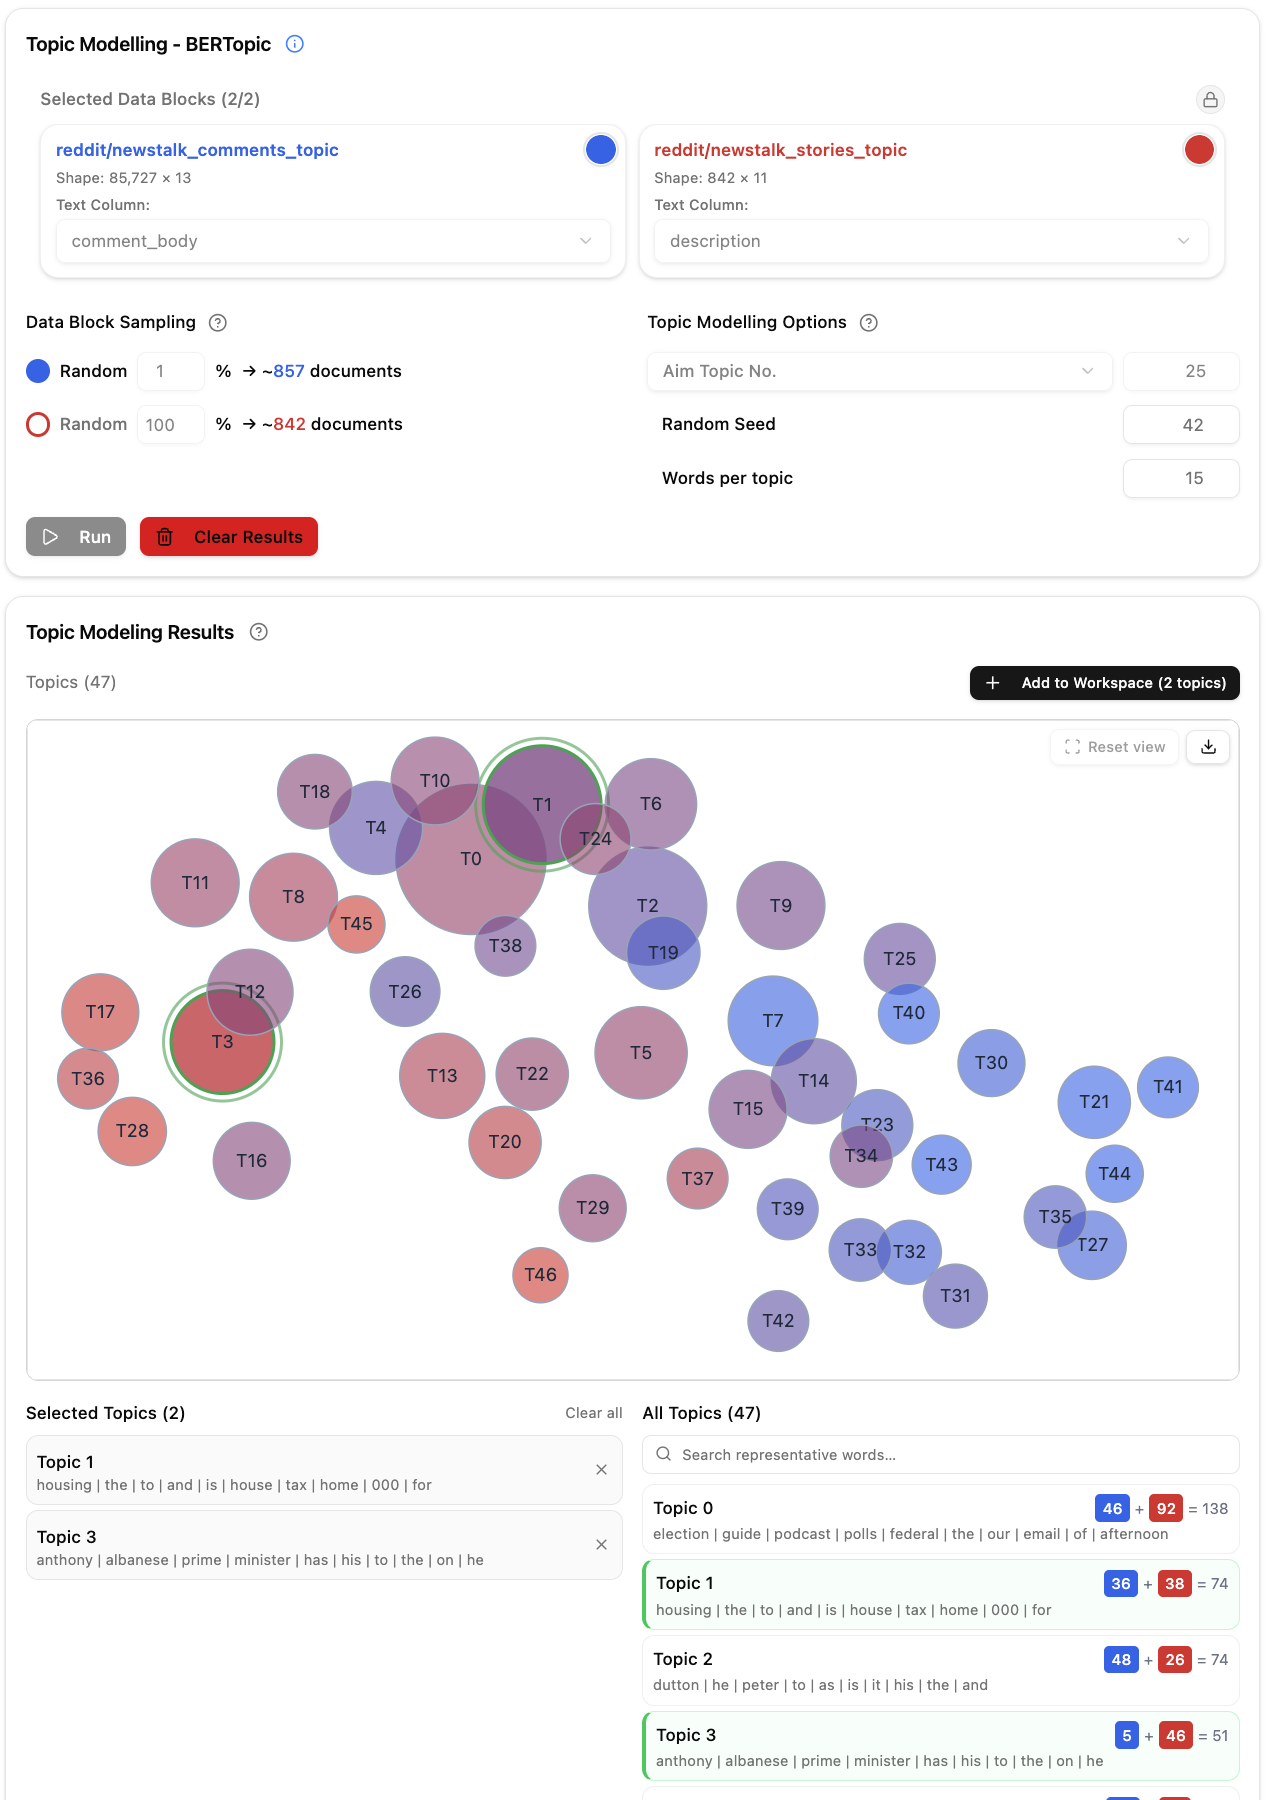
Topic modelling helps you discover themes in a large collection of documents. The app uses BERTopic under the hood: a deep-learning method that builds clusters from contextual sentence embeddings. Every document is associated with one primary topic, so topics can also be thought of as theme-based document groups. Different topics may share vocabulary at different weights.
This guide walks through every setting in the parameter panel and explains what it does, what values to use, and what to expect from the results.
The parameter panel starts with the selected data blocks. Each block owns its text-column choice and sampling percentage. The compact parameter row below controls how topics are formed, reproducibility, and display.
Use the data-block selector at the top to pick which corpus (or corpora) to analyse. You can select up to two at once for a side-by-side comparison; their text columns are combined for the model run, and the results show a comparison of topics between the two.
For each selected block, choose the text column that contains the documents you want to analyse. Only columns that hold plain text are available.
Embedding (converting documents into numbers the model can work with) is the slowest part of the process. If your corpus has tens of thousands of documents or more, running on the full set can take a very long time. Sampling lets the model work on a representative subset instead.
How it works
- Each selected data block card includes a Sampling (N documents) number input beside the text-column selector.
- The default is 100% per data block, which uses the full selected corpus.
- The title shows the effective number of documents that will be processed after applying the percentage.
- Increase the percentage for better topic stability; decrease it for faster exploratory runs.
Guidelines
| Corpus size | Suggested approach |
|---|---|
| < 100 docs | Use 100% |
| 100 – 5,000 docs | Start with 20–100% depending on how quickly the run needs to fit |
| 5,000 – 50,000 | Use 10–50% for exploration, then increase for stability |
| > 50,000 | Start with 1–10% and increase when time allows |
A working set of 10,000 – 50,000 documents typically gives good topic quality while keeping run times manageable. Going much lower can produce noisy or unstable topics; going much higher increases run time without a proportional gain in quality.
If the working set is less than five times the target number of topics, a warning appears below the selected data blocks. If you see it, either increase the sampling percentage or reduce the number of topics you are aiming for.
The dropdown controls how you express "how many topics do I want?" Three modes are available; the value field next to the dropdown changes meaning depending on which one you pick.
Set a rough target for the number of topics you would like. The model uses this to decide how large each cluster needs to be before it counts as a topic — smaller targets mean larger, broader topics; larger targets mean smaller, more specific ones.
- The model will not produce exactly this number. Think of it as a hint, not a strict instruction.
- A typical starting point is 20–80 topics depending on the variety of your corpus.
- If you get far fewer topics than expected, try raising the target. If you get far more, try lowering it.
Set the minimum number of documents that must share a theme for it to be counted as a topic. Documents that do not fit any topic are placed in an outlier group (Topic −1).
- The default value is calculated automatically from your working-set size: roughly working-set-size ÷ (10 × aim-topic-no). You do not need to change it unless the automatic value gives unwanted results.
- A higher min size → fewer, broader topics and a larger outlier group.
- A lower min size → more topics, including small niche ones, but also more noise.
- Useful when you want exact control over granularity rather than a target count.
The model first finds topics naturally, then merges the most similar ones until it reaches the number you specified.
- Unlike Aim Topic No., this does produce the exact count you request.
- Because topics are merged rather than discovered at that resolution, fine distinctions between similar themes may be lost.
- Useful when you need a fixed number of topics for comparison or reporting.
The number next to the dropdown starts greyed-out, showing an automatically calculated value. Click into the box and press Tab (or type a new number and press Tab) to lock in your chosen value. The minimum is 2.
The number changes colour to warn you when the ratio of topics to documents becomes unfavourable:
| Colour | What it means | Rule of thumb |
|---|---|---|
| Grey (default) | Value is auto-calculated; not yet committed | — |
| Black | Value committed by the user; ratio looks fine | ≥ 10 documents per estimated topic |
| Orange | Ratio is getting tight; topics may be noisy | 3–9 documents per estimated topic |
| Red | Ratio is too high; results will likely be unreliable | Fewer than 3 documents per estimated topic |
The ratio is calculated differently depending on the mode:
- Aim Topic No. / Exact Topic No.: working-doc count ÷ value entered. For example, 500 documents with a target of 80 topics → 6.25 docs/topic → orange.
- Min Topic Size: the value itself is already the minimum number of documents per topic, so it is compared directly. For example, a min topic size of 2 → red regardless of corpus size.
If you see orange or red, hover over the input for a short explanation. The most common fixes are to increase the working document count (raise sampling) or lower the number of topics.
A number that controls the randomness in the process. Using the same seed on the same data will always produce the same result — useful when you want to reproduce a run or compare settings systematically.
- Default: 0 (any non-negative whole number works).
- This value starts greyed-out. Change it to check that your results are not an artefact of a particular random initialisation — run the same settings with two or three different seeds and see whether the topics are stable.
- If topics change substantially between seeds, the corpus or settings may not be well-suited to the chosen number of topics.
How many representative words to display for each topic in the results.
- Default: 15. Range: 1–50.
- More words help you interpret ambiguous topics, but too many words can clutter the display.
- 10–20 is a good range for most use cases.
- This parameter only affects the visualisation; the underlying topics are unchanged.
Once the settings look right, click Run Analysis. A progress bar shows where the tool is in the pipeline:
| Stage | Typical progress | What is happening |
|---|---|---|
| Loading data | 3–7 % | Reading documents from the workspace |
| Loading model | ~7 % | Loading the embedding model into memory |
| Embedding | 8–63 % | Converting each document into a numeric representation — this is the slowest stage |
| Clustering | ~65–89 % | Grouping documents by similarity |
| Building topics | ~90 % | Extracting representative words for each group |
| Saving results | ~90–100 % | Writing the output |
The first run after starting the app takes longer because the embedding model must be loaded into memory. Subsequent runs reuse the cached model.
Use the result panel to explore the topic map, labels, and summary counts. You can also select topics of interest and detach the relevant documents from the data block(s) into new derived data blocks for further analysis.
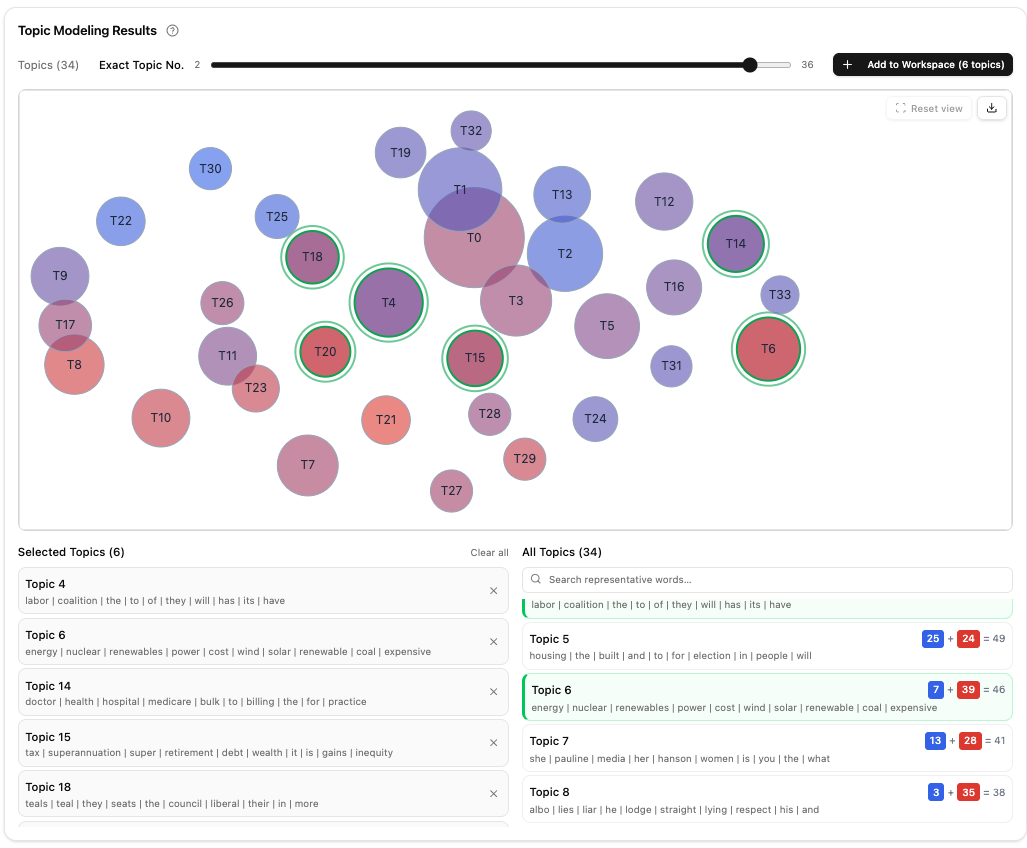
Each circle in the bubble chart represents an individual topic, named sequentially from Topic 0. When you hover over a bubble, the representative words and the number of documents associated with that topic are displayed.
The size of each bubble corresponds to the number of associated documents. In two-corpus mode, each bubble's colour blends the two corpus colours proportionally to the document split between them.
The distance between two bubbles indicates their semantic similarity — the closer two topics appear on this chart, the more similar they, and their associated documents, are to each other.
You can click to select or deselect a topic in the bubble chart. Your selection is also reflected in the bottom pane, where all topics are listed in two columns. Selecting topics lets you detach only the documents associated with those topics from the data block(s) as new derived data blocks.
Choose Add to Workspace to select the source Data Blocks and source columns, confirm the new names, and start the detachment. With no selected topics, all topics are included. Each selected source creates a topic-data Data Block and a linked topic-meanings Data Block. The original Topic Modeling Result remains available in its tab.
A quick wildcard filter can be applied using the text input in the right ("All Topics") column, which lets you quickly find all topics that contain a keyword of interest.
Topic −1 (outliers) is the group of documents that did not fit well into any topic. A small outlier group is normal; a very large one (e.g. more than a third of documents) may mean the topics are too narrow, the corpus is very diverse, or the sample is too small.
The tab keeps its current Topic Modelling Analysis in the backend so it can reload its lifecycle and Result pages. Clear Results removes that Analysis and resets the tab, including after failure or cancellation. Re-run clears the current Analysis before submitting its replacement.
| Symptom | Likely cause | What to try |
|---|---|---|
| Far fewer topics than the target | Min topic size too high relative to corpus | Increase the target number, or increase the sample size |
| Almost all documents are outliers | Min topic size too high, or corpus too varied | Lower Min Topic Size, raise sampling, or accept fewer topics |
| Topics all look the same | Target too low | Increase Aim Topic No. |
| Results change a lot between runs | Topics are not stable — corpus may be too small or too diverse for this number of topics | Try different seeds; reduce target; increase sample |
| Very long run time | Large working set | Reduce the sampling percentage |
| Setting | Default | Reasonable range |
|---|---|---|
| Sampling | 100% per data block | Aim for 10,000–50,000 docs in working set |
| Topic size mode | Aim Topic No. | — |
| Aim Topic No. | Auto | 10–200 depending on corpus size and diversity |
| Random Seed | 0 | Any non-negative whole number |
| Words per topic | 15 | 10–20 |
- Run topic modelling on a single corpus with the default sampling and default Aim Topic No. mode.
- Switch to Exact Topic No. with a small number (e.g. 10) and compare the granularity.
- Re-run with two different random seeds and check whether the dominant topics remain stable.
- Detach a topic of interest into a new data block for further analysis.